Business Process Modeling Techniques: 9 Methods and How to Choose the Right One

Every successful business runs on processes—some efficient, others chaotic. But without a clear way to visualize and improve them, how can you make meaningful change?
That’s where business process modeling techniques come in: they turn complexity into clarity and empower real transformation.
In this guide, we compare the 9 most used techniques — from BPMN and flowcharts to EPC, DFD, and IDEF0 — with real diagram examples and a simple framework to pick the right one for each situation.
What Is Business Process Modeling?
Business process modeling is the practice of creating a visual representation of how a business process works: the sequence of tasks, the people or systems that perform them, the decision points along the way, and the inputs and outputs each step produces.
It helps teams understand how work actually gets done, identify inefficiencies, and create a reliable foundation for standardization, optimization, or automation.
Why Model Business Processes?
Organizations invest in process modeling because a good model delivers benefits that plain documentation cannot:
- Shared understanding – A diagram removes ambiguity: everyone sees the same steps, owners, and handoffs
- Faster onboarding and training – New team members learn a process in minutes instead of weeks
- Compliance and auditability – Visual, versioned models make audits (ISO, SOX, LGPD/GDPR) dramatically easier
- A baseline for improvement – You can only measure and improve what you can see; models expose bottlenecks, rework, and waste
- Automation readiness – Executable notations like BPMN turn a diagram into the blueprint for workflow automation
Modeling vs. Mapping vs. Management
These three terms are often confused:
- Process mapping is the broader, usually higher-level activity of visualizing a workflow to understand it — see our full guide to business process mapping
- Process modeling goes deeper: it uses a standardized notation, captures logic and exceptions, and can support simulation and automation. Models typically evolve from an as-is state to an improved to-be design
- Business process management (BPM) is the ongoing discipline that uses modeling as one of its phases — alongside analysis, execution, monitoring, and continuous improvement
Choosing the right modeling technique can make the difference between confusion and actionable insight — which is exactly what the rest of this guide is about.
The 9 Most Common Business Process Modeling Techniques
Let’s explore the nine most widely used techniques that professionals rely on today:
1. BPMN (Business Process Model and Notation)
BPMN is the most widely adopted and standardized technique for modeling business processes. Developed by the Object Management Group (OMG), it provides a rich, consistent visual language that bridges the gap between business analysts and technical teams.
Key Features of BPMN:
- Graphical clarity – Uses standardized shapes and flows for precise modeling
- Execution-ready – Ideal for process automation and integration with BPM systems
- Versatile – Supports everything from simple flows to complex, event-driven processes
Core Elements:
- Events: Represent process start, interruptions, or end points
- Tasks: Actions performed within the process
- Gateways: Decision or branching logic (e.g., exclusive, parallel, inclusive)
- Flows: Define the order and condition of process execution
- Pools and lanes: Distinguish roles, departments, or external entities involved
Use Cases:
- Automating workflows and RPA orchestration
- Visualizing cross-departmental interactions
- Creating compliant, auditable process documentation
- Designing processes with integrations to ERP, CRM, or custom systems
BPMN is especially powerful when paired with tools like HEFLO, which combine an intuitive drag-and-drop editor with process documentation, publishing capabilities, and AI-powered modeling features.
For an in-depth guide covering BPMN subprocesses, gateways, pools, message flows, and modeling tips, check out:
🔝 BPMN Notation: Complete Guide for Effective Process Modeling
2. Flowcharts
Flowcharts are one of the most traditional and widely used techniques for visualizing processes. Their simplicity and universal symbols make them ideal for quickly communicating workflows—especially to non-technical stakeholders.
Key Features of Flowcharts:
- Simple and intuitive – No steep learning curve
- Flexible – Suitable for almost any linear or decision-based process
- Quick to build – Great for early-stage process design or documentation
Common Symbols:
- 🔷 Terminator (Oval): Start and end of the process
- 🟦 Process (Rectangle): A task or action
- 🔶 Decision (Diamond): A yes/no or true/false branching point
- ➡️ Arrows: Direction and flow of logic
Want to master the visual language of flowcharts? Explore the full list of official shapes and meanings in our guide:
🔝 The Meaning of 23 Flowchart Symbols
Use Cases:
- Mapping customer service workflows
- Designing approval processes
- Training materials and SOP documentation
- First drafts before transitioning to BPMN or automation
💡 Flowcharts are perfect for communicating high-level ideas quickly—especially when formal BPM notations aren't required.
3. Swimlane Diagrams (Cross-Functional Flowcharts)
Swimlane diagrams extend the classic flowchart by dividing the process into horizontal or vertical lanes — one per role, team, department, or system. The result answers the question every process discussion eventually reaches: who does what, and where do handoffs happen?
Key Features of Swimlane Diagrams:
- Responsibility at a glance – Every activity sits inside the lane of its owner
- Handoff visibility – Crossing a lane boundary makes transfers of work (and their delays) explicit
- Familiar symbols – Uses the same shapes as flowcharts, so no new learning curve
Structure:
- Lanes: One per actor (e.g., Requester, Manager, Finance, ERP system)
- Flowchart symbols: Tasks, decisions, and start/end points placed inside the lanes
- Cross-lane arrows: Highlight each handoff between actors
Use Cases:
- Approval workflows that involve several departments
- Clarifying accountability when responsibilities overlap
- Diagnosing delays caused by handoffs between teams
- Documenting processes before formalizing them in BPMN
💡 If a process problem sounds like “it gets stuck between departments,” a swimlane diagram is usually the fastest way to see why.
4. SIPOC Diagrams
SIPOC diagrams are high-level process maps used to provide a broad overview of a process before diving into details. The acronym stands for Suppliers, Inputs, Process, Outputs, and Customers—five key components that define the boundaries of any business process.
They are especially useful in Lean Six Sigma, process discovery, and continuous improvement initiatives.
Key Features of SIPOC:
- Big-picture perspective – Focuses on inputs and outputs, not individual steps
- Stakeholder alignment – Helps everyone agree on what the process does and why
- Non-technical – No need for complex notation or tools
Structure Explained:
| Element | Description |
|---|---|
| Suppliers | Entities providing inputs (people, systems, vendors) |
| Inputs | Resources or data needed to start the process |
| Process | The core activity (usually limited to 4–7 steps) |
| Outputs | Deliverables or results of the process |
| Customers | Recipients of the outputs (internal or external) |
Use Cases:
- Initial mapping before BPMN modeling
- Defining scope during project kickoffs
- Preparing for Six Sigma or Kaizen workshops
- Standardizing how processes are described at a business level
💡 Use SIPOC to align business and technical teams—especially during early process discovery and mapping phases—before modeling the detailed flow.
Want to explore more about mapping workflows? Read: 👉 Business Process Mapping: Understanding and Improving Workflows
5. UML Activity Diagrams
UML Activity Diagrams come from the Unified Modeling Language (UML) and are primarily used in software and systems engineering. However, they can also serve as a powerful tool for modeling business processes—especially when workflows involve user-system interactions, parallel operations, or conditional logic.
Key Features of UML Activity Diagrams:
- Formal and precise – Ideal for systems where logic and transitions matter
- Supports parallelism – Clearly shows concurrent activities and synchronization
- Object-oriented mindset – Integrates well with software development lifecycles
Common Elements:
- Activities: Represented by rounded rectangles (like tasks)
- Decisions and merges: Diamond shapes for flow control
- Forks and joins: Show parallel execution paths
- 🟢 Initial node and 🔴 final node: Represent start and end of the flow
Use Cases:
- Modeling user interactions with systems
- Representing backend business logic in system design
- Visualizing concurrent processes (e.g., parallel approvals)
- Creating process documentation in software development projects
💡 UML Activity Diagrams are particularly useful in projects where business processes and technical architectures must be tightly aligned.
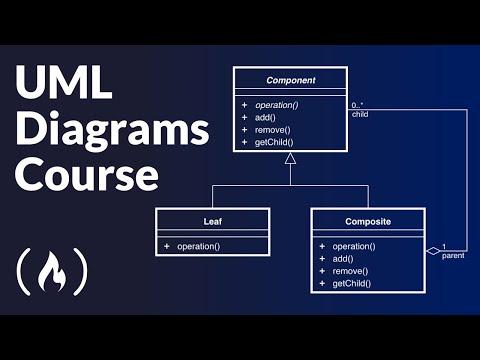
➡️ Want to dive deeper into UML? Here's a complete video course covering all major UML diagrams:
6. EPC (Event-driven Process Chain)
Event-driven Process Chains (EPC) model a process as an alternating sequence of events (states) and functions (activities), connected by logical operators. Created in the early 1990s by August-Wilhelm Scheer, EPC became the backbone of the ARIS methodology and gained massive adoption in SAP-centric organizations, where it was long the standard way to document ERP processes.
Key Features of EPC:
- Event–function rhythm – Every activity is triggered by an event and produces a new one, making cause and effect explicit
- Logical connectors – AND, OR, and XOR operators express splits and joins precisely
- Enterprise-architecture friendly – Integrates organizational units, systems, and data into the same diagram
Core Elements:
- 🟣 Events: Hexagons describing a state ("Invoice received", "Order approved")
- 🟩 Functions: Rounded rectangles describing activities ("Check invoice")
- Connectors: AND / OR / XOR operators controlling the flow logic
- Extended objects: Organizational units, systems, and documents attached to functions
Use Cases:
- Documenting processes in SAP or other ERP implementations
- Enterprise architecture initiatives based on ARIS
- Legacy process repositories in large industrial companies
7. Value Stream Mapping (VSM)
Value Stream Mapping (VSM) is a Lean technique used to visualize every step in a process—from request to delivery—and distinguish between activities that add value and those that don’t. Unlike other modeling methods, VSM focuses on time, flow, and waste.
Origins in Lean Manufacturing
VSM was originally developed within the Lean Manufacturing framework, notably as part of the Toyota Production System. In that context, it helps identify and eliminate waste (muda) across the production line—such as excess inventory, delays, rework, and unnecessary movement.
Today, its use has expanded far beyond the factory floor. VSM is now widely applied in:
- Lean office environments
- Finance and procurement workflows
- Shared services centers
- IT and DevOps (e.g., value stream delivery platforms)
➡️ Watch this short video on how VSM works in Lean Manufacturing:

Key Features of VSM:
- End-to-end view – Maps the entire value chain across teams or systems
- Time-focused – Highlights lead time, cycle time, and delays
- Lean-driven – Aims to eliminate non-value-adding steps (waste)
Common Components:
- 🏠 Processes – Activities that transform inputs into outputs
- 📦 Inventory icons – Represent queues or stock between steps
- ⏱️ Timeline – Shows how long each activity and wait state takes
- 🔄 Material and information flows – Visualize data movement and physical goods
Use Cases:
- Improving order-to-cash or procure-to-pay processes
- Analyzing production or delivery bottlenecks
- Visualizing service delays in call centers or IT support
- Prioritizing automation or optimization opportunities
💡 Value Stream Mapping helps leaders see the full picture—from request to delivery—and focus on what truly creates value.
8. Data Flow Diagrams (DFD)
Data Flow Diagrams (DFD) model a process from a different angle: instead of the sequence of activities, they show how information moves — where data comes from, which processes transform it, where it is stored, and who consumes it. Popularized by the Yourdon and Gane–Sarson structured-analysis methods, DFDs remain a staple of systems analysis.
Key Features of DFD:
- Data-centric view – Reveals information dependencies that activity diagrams hide
- Hierarchical levels – A context diagram (level 0) decomposes into progressively detailed levels
- Simple vocabulary – Only four element types, easy to learn
Core Elements:
- External entities: Sources or destinations of data outside the system (squares)
- Processes: Transformations applied to data (circles or rounded rectangles)
- Data stores: Databases, files, or archives (open-ended rectangles)
- Data flows: Arrows showing the movement of information
Use Cases:
- Systems analysis and integration mapping (ERP, CRM, APIs)
- Documenting data lineage for privacy compliance (GDPR, LGPD)
- Understanding information bottlenecks in document-heavy processes
9. IDEF0
IDEF0 is a formal function-modeling standard developed for the U.S. Air Force in the 1980s. It represents a process as a hierarchy of functions, where each box is described by its ICOM arrows: Inputs (left), Controls (top), Outputs (right), and Mechanisms (bottom).
Key Features of IDEF0:
- Rigorous decomposition – Each function breaks down into a child diagram, from A-0 (context) to any depth
- Controls made explicit – Policies, rules, and standards governing each activity appear on the diagram itself
- Notation-level discipline – A published standard (FIPS 183) governs syntax and layout
Use Cases:
- Defense, aerospace, and manufacturing programs that mandate the standard
- Regulated industries where governing rules must be visible per activity
- High-level functional decomposition before detailed workflow design
Comparison Table: Choosing the Right Modeling Technique
Use this table to quickly compare modeling approaches and choose the one that fits your goals and audience.
| Technique | Best For | Complexity | Automation-Ready | Tool Examples |
|---|---|---|---|---|
| BPMN | Detailed, executable workflows | High | ✅ Yes | HEFLO, Camunda, Bizagi |
| Flowchart | Simple, intuitive diagrams | Low | ❌ No | Lucidchart, Draw.io |
| Swimlane | Cross-team responsibilities and handoffs | Low | ❌ No | Lucidchart, Visio |
| SIPOC | High-level scoping and process overview | Low | ❌ No | Excel, Templates |
| UML Activity | System interactions and logic modeling | Medium | ✅ Sometimes | Visual Paradigm, StarUML |
| EPC | ERP-centric enterprise documentation | Medium | ⚠️ Limited | ARIS, SAP Signavio |
| VSM | Lean analysis and waste elimination | Medium | ❌ No | Manual, Miro, Excel |
| DFD | Data movement between systems | Medium | ❌ No | Visio, Draw.io |
| IDEF0 | Hierarchical functional decomposition | High | ❌ No | Visio, IDEF0 tools |
How to Choose the Right Modeling Technique
With nine options on the table, the choice comes down to four questions:
- Who is the audience? Business stakeholders respond best to flowcharts, swimlanes, and SIPOC. Mixed business–IT teams should standardize on BPMN. Engineers may prefer UML or DFD.
- What is the goal? Aligning scope, communicating a workflow, eliminating waste, and automating a process are different jobs — and each has a best-fit technique.
- How much detail do you need? A one-page overview (SIPOC, VSM) and an executable model with exceptions and events (BPMN) sit at opposite ends of the spectrum.
- Will the model ever run? If automation is on the roadmap — even later — model in BPMN from the start and you won’t have to redraw everything.
As a quick reference:
- Need to align stakeholders on scope → SIPOC
- Need to explain a process quickly → Flowchart
- Need to show who does what across teams → Swimlane diagram
- Need automation-ready, standardized models → BPMN
- Need to model user–system logic → UML Activity Diagram
- Need to document SAP/ERP processes in ARIS → EPC
- Need to cut lead time and waste → Value Stream Mapping
- Need to trace how data moves → DFD
- Need formal functional decomposition → IDEF0
Free BPMN Modeling Video Lesson
Want to learn BPMN modeling step by step? We offer a free video lesson where you’ll discover:
- How to create pools, lanes, events, tasks, flows, and gateways
- How to apply BPMN best practices for clarity and layout
- How to model collaboration between participants
- Common mistakes to avoid when starting
BPMN Examples You Can Use Today
Looking for practical models you can study, download, or adapt to your own workflows? Here are two ready-to-use BPMN diagrams created with HEFLO—designed to reflect real-world business needs.
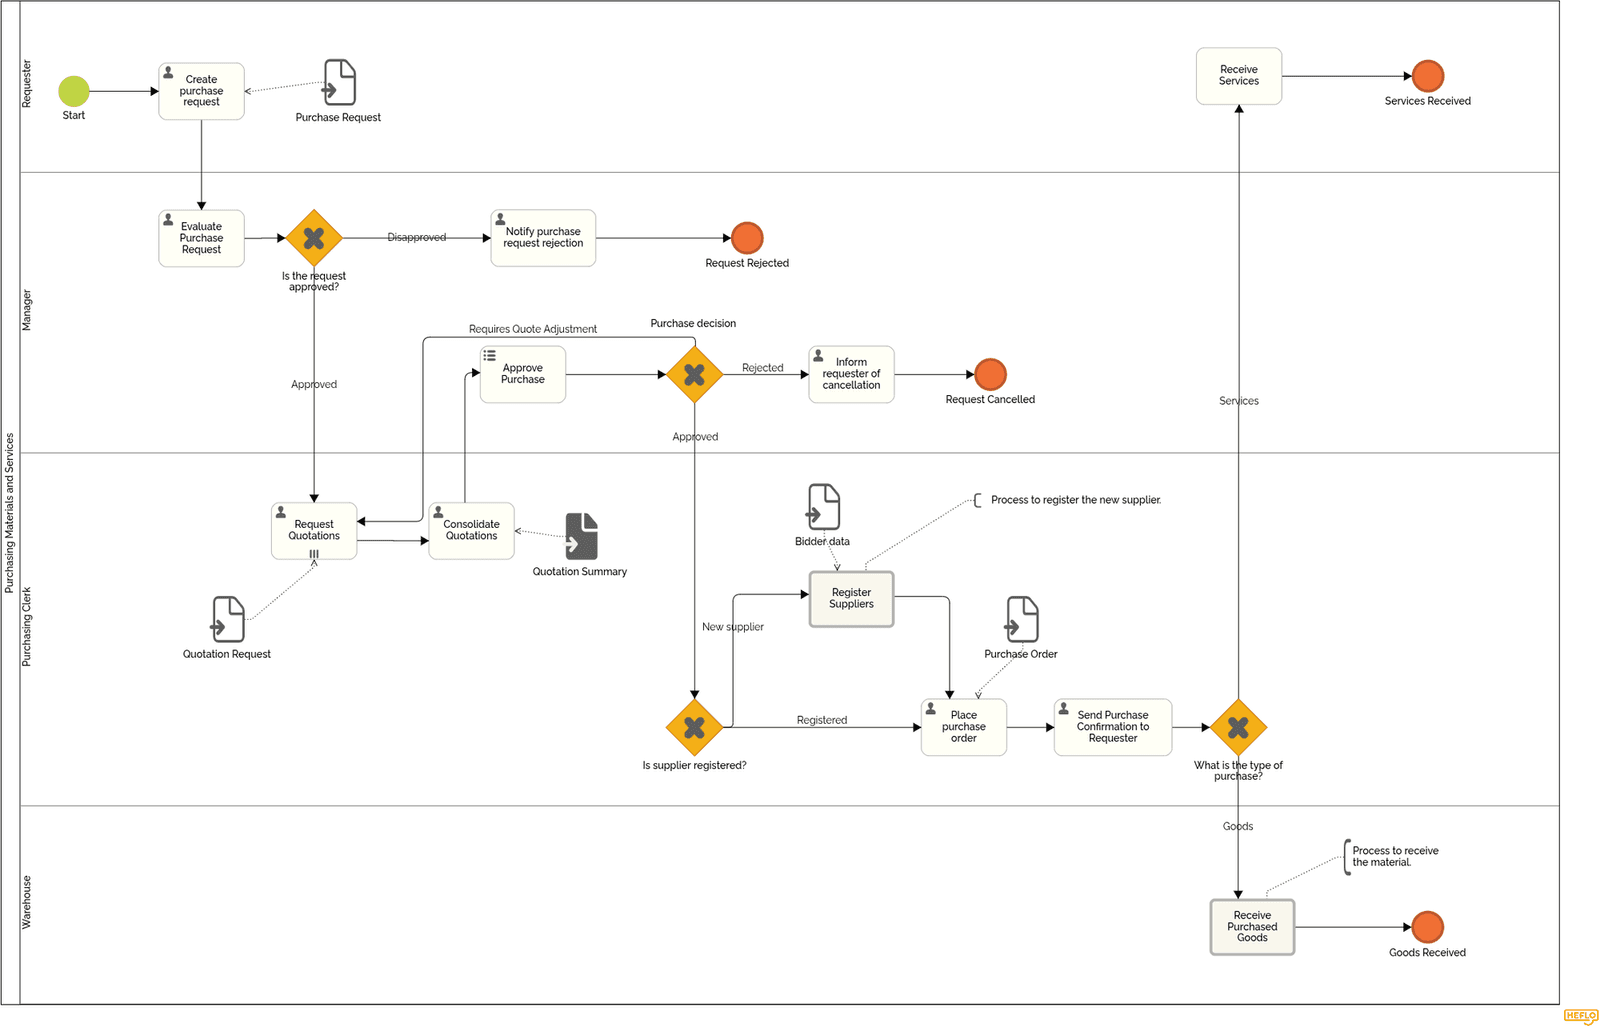
Example 1: Purchase Request and Approval Workflow
This BPMN model represents a typical purchase requisition process, where employees request items or services, which must go through a structured approval flow before purchase.
Useful for:
- Procurement and finance teams
- Controlling departmental budgets
- Integrating with ERP or e-procurement systems
What’s included:
- BPMN 2.0 diagram
- 👉 HEFLO online version
- PDF documentation
- 🎧 Listen to the full explanation in our Spotify podcast episode.
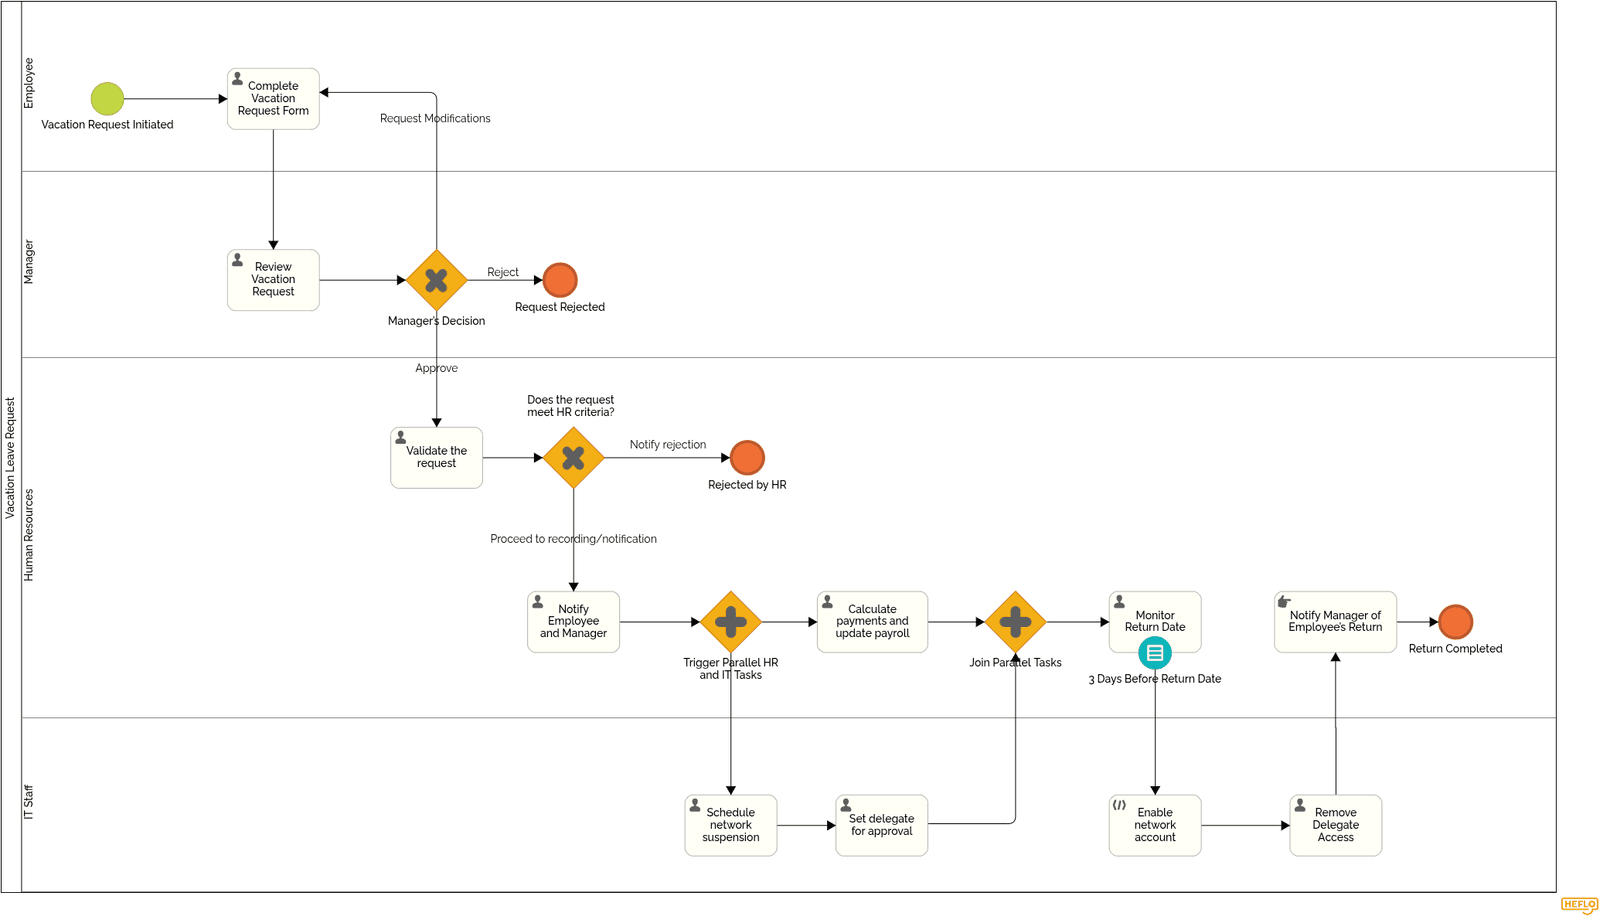
Example 2: Leave Request and Manager Approval
This model shows a streamlined employee leave request flow, from submission to HR registration. It handles approvals, rejections, and notifications—all in one clear diagram.
Useful for:
- HR teams in small and mid-sized companies
- Automating PTO and vacation tracking
- Ensuring consistency in approvals
What’s included:
💡 Both models can be edited online, exported, and customized to suit your company’s reality—no installation required.
Frequently Asked Questions (FAQ)
What are business process modeling techniques?
Business process modeling techniques are structured ways to visually represent how a business process works. These techniques help teams understand workflows, identify inefficiencies, and improve or automate processes.
What are the phases of business process modeling?
The business process modeling lifecycle includes:
- Identification – Define the process scope and objectives
- Discovery and Documentation – Collect data through interviews, forms, and observations
- Modeling (As-Is) – Map out the current state of the process
- Analysis – Detect inefficiencies, bottlenecks, or compliance issues
- Design (To-Be) – Propose an improved version of the process
- Validation – Review with stakeholders for accuracy and alignment
- Implementation – Deploy the new model, often with automation support
- Continuous Improvement – Monitor performance and refine as needed
✅ Choosing the right business process modeling technique at each stage ensures clarity and effectiveness.
What is the difference between process modeling and process mapping?
Process mapping is the broader activity of visualizing a workflow to understand it, usually at a high level. Process modeling is more rigorous: it uses a standardized notation such as BPMN, captures decision logic and exceptions, and produces models precise enough for analysis, simulation, or automation. In short, every model is a map, but not every map is a model.
What is the difference between business process modeling and business process management?
Business process management (BPM) is the end-to-end discipline of improving how an organization works — identifying, designing, executing, monitoring, and optimizing processes. Business process modeling is one phase of that discipline: creating the visual representation that the other phases analyze, execute, and improve.
Which is the most popular technique?
BPMN (Business Process Model and Notation) is the most widely adopted, especially for enterprise-grade processes that require precision, collaboration between business and IT, and automation readiness.
What is the simplest modeling technique?
Flowcharts are the simplest and most intuitive technique. They’re easy to create and understand, making them ideal for onboarding, documentation, and quick drafts.
Can I use multiple techniques together?
Yes. Many organizations start with a SIPOC diagram or flowchart for overview and then transition to BPMN or UML for detailed modeling and automation planning. Choosing the right combination depends on your audience and objectives.
Do I need specialized tools to create models?
Not necessarily. Flowcharts can be built with tools like Lucidchart or even PowerPoint. For BPMN, however, it’s recommended to use tools like HEFLO, Bizagi, or Signavio, which support the notation and automation workflows.
Is there a free BPMN tool I can use?
Yes! Several free BPMN tools allow you to model business processes without needing a paid license. Some popular options include:
- HEFLO (Free Plan) – Cloud-based, user-friendly, with BPMN 2.0 support and process publishing
🎓 HEFLO also offers an Academic Program that gives students from partner universities free access to its full BPMN training platform. - Camunda Modeler – Desktop application focused on BPMN for automation projects
- Bizagi Modeler – Rich features with export options, ideal for documentation
- Yaoqiang BPMN Editor – Lightweight open-source tool with full BPMN support
Can ChatGPT generate BPMN?
ChatGPT can help generate text-based BPMN descriptions or code snippets that follow the BPMN 2.0 standard. However:
- It cannot render or visualize diagrams
- Outputs may lack technical validation or formatting
- You’ll still need a dedicated BPMN tool to view and edit the model
💡 HEFLO solves this gap by offering an integration with ChatGPT. You describe the process in natural language, and HEFLO generates a visual diagram, documents each task, and allows editing—all with a free plan for up to 5 workflows/month.
How to draw a BPMN diagram?
To draw a BPMN diagram, follow these steps:
- Identify the start and end events
- List the main tasks or activities
- Define decision points (gateways)
- Organize flow using swimlanes or pools
- Use a BPMN-compliant tool to build and validate
📘 For a full tutorial with real BPMN elements, see:
👉 BPMN Notation: Complete Guide for Effective Process Modeling
Recommended Reading by Technique
Looking to go beyond diagrams and gain deeper mastery of each technique? Here’s a curated book for each modeling method:
For BPMN
"BPMN Method and Style" by Bruce Silver
A definitive guide that explains both the mechanics and best practices of BPMN 2.0, including style rules for clarity and automation readiness.
🛒 Buy on Amazon
For Flowcharts
"The Art of Clear Thinking" by Rudolf Flesch
While not specific to flowcharts, this classic helps readers structure visual thinking clearly—an essential complement to effective flowcharting.
🛒 Buy on Amazon
For SIPOC and Lean Six Sigma
"The Lean Six Sigma Pocket Toolbook" by Michael George et al.
A concise reference with excellent SIPOC examples and usage in DMAIC methodology.
🛒 Buy on Amazon
For UML Activity Diagrams
"UML Distilled" by Martin Fowler
A compact and readable guide to the core UML diagrams, with a solid section on activity diagrams, tailored for software and systems modelers.
🛒 Buy on Amazon
For Value Stream Mapping
"Learning to See" by Mike Rother and John Shook
A Lean classic that teaches how to identify value streams, map them effectively, and apply continuous improvement in manufacturing and services.
🛒 Buy on Amazon
Conclusion: Start Modeling Smarter
Mastering business process modeling techniques is not just theory—it’s a strategic capability. Whether you're mapping workflows for clarity, preparing teams for automation, or optimizing for efficiency, these techniques provide the foundation for meaningful change.
Each method has its own strengths—and they are not mutually exclusive:
- Start with a SIPOC diagram to define scope and align expectations
- Use flowcharts and swimlane diagrams for quick visualization, communication, and handoff clarity
- Transition to BPMN or UML activity diagrams for automation-ready precision and system design
- Apply Value Stream Mapping to expose inefficiencies and reduce lead times across entire value chains
- Reach for EPC, DFD, or IDEF0 when your context demands them — ERP documentation, data lineage, or formal functional decomposition
In real-world projects, teams often combine these approaches across different phases—discovery, design, execution, and improvement.
💼 Need a platform to put all this into practice?
Try HEFLO — a free, cloud-based BPMN tool that lets you:
- Create unlimited workflows manually
- Use AI to generate up to 5 diagrams per month from text
- Document each task automatically
- Export and share your processes as BPMN files or PNG images
It's the ideal bridge between business users and IT teams—whether you're getting started or scaling operations.
If you’re using the Lite or Enterprise plans, you can go even further: publish diagrams to a branded portal, gather feedback from stakeholders, and generate professional-grade documentation with just a few clicks.
📥 Want to see an example? Download a sample documentation package generated with HEFLO below.