What is the Ishikawa Diagram? Meaning, Categories, and Real-World Examples

The Ishikawa Diagram, also known as the Fishbone Diagram or Cause and Effect Diagram, is a widely used tool in quality management and process improvement to identify, organize, and analyze possible causes of a specific problem or undesirable outcome.
Created in the 1960s by Kaoru Ishikawa, a Japanese professor and engineer, this diagram provides a visual structure to guide analytical thinking and collaborative discussions around a problem. Its main goal is to help teams explore root causes—going beyond symptoms—so that failures impacting the performance of a process, product, or service can be addressed effectively.

The diagram resembles a fish skeleton, with the problem stated at the “head” and possible causes branching out along the “bones.” These causes are usually grouped into categories, such as people, methods, equipment, and materials.
Why Use the Ishikawa Diagram?
- To solve complex problems in a visual and structured way
- To encourage critical and collaborative thinking among multidisciplinary teams
- To identify true root causes, avoiding superficial fixes
- To prevent future issues by systematically analyzing risks
Common Categories of Causes
One of the strengths of the Ishikawa Diagram lies in the logical organization of potential causes. Instead of brainstorming causes randomly, the diagram helps teams group ideas into categories, which makes it easier to identify patterns, critical areas, and improvement opportunities.
Categorization also encourages the analysis of different dimensions of the problem, preventing a limited or biased view. Depending on the context—industrial, administrative, or service-oriented—different category models can be used. Below are the most common:
6M Model – For Manufacturing and Industry
This model is widely used in factories and production environments because it reflects the main variables that affect quality in manufacturing:
- Machines – Equipment, technology, and tools
- Methods – Processes, procedures, instructions
- Materials – Input quality, suppliers, standardization
- Manpower – Skills, training, human error, turnover
- Mother Nature (Environment) – Workplace conditions, external environment
- Measurements – Metrics, instruments, inspection controls
Adapted Model – For Services and Office Environments
In administrative settings, digital companies, or service areas, the classic model can be adapted to better reflect relevant factors. Common categories include:
- People: Skills, engagement, communication
- Processes: Workflow, bureaucracy, lack of standardization
- Technology/Systems: Integration issues, performance problems
- Customers: Expectations, communication, satisfaction
- Policies and Rules: Internal procedures, legal requirements
- Organizational Culture: Leadership style, resistance to change
Practical Examples with Scenarios and Cause Breakdown
Example 1: Investigating Torque Inconsistencies in Toyota's Assembly Line
As part of its focus on continuous improvement, Toyota identified an unusually high rate of engine ignition failures during final quality inspections. To safeguard product reliability and customer satisfaction, the company launched a root cause analysis using the Ishikawa Diagram. This approach enabled teams to systematically map and address the potential causes, leading to effective corrective actions.
Possible causes:
- Manpower – Issues related to people (e.g., training, skills, staffing)
- Method – Problems with processes or procedures
- Machine – Failures or malfunctions in tools, equipment, or technology
- Material – Defects or inconsistencies in raw materials or components
- Environment – External conditions affecting the process (e.g., temperature, humidity, workspace)
- Measurement – Problems related to inspection, testing, or data collection methods

📋 Proposed Corrective Actions:
- Review and standardize operator training with hands-on practice.
- Update work instructions with clear, illustrated steps.
- Implement weekly recalibration of all torque tools.
- Conduct pre-assembly testing of spark plug batches.
- Control and stabilize temperature in the assembly area.
- Implement a digital checklist system for torque and ignition checks.
Learn More About Total Quality Management (TQM)
Toyota’s approach to quality management goes beyond individual tools like the Ishikawa Diagram. It is deeply rooted in the philosophy of Total Quality Management (TQM), which emphasizes continuous improvement, customer satisfaction, and systematic problem-solving.
▶️ Watch this complete video on Total Quality Management to understand how companies like Toyota build a culture of quality:

Example 2: Investigating Drying Process Issues at Nestlé
Committed to delivering consistent product quality, Nestlé identified a rise in customer complaints regarding the taste of its powdered milk. To address the issue comprehensively, the company initiated a root cause analysis using the Ishikawa Diagram. This structured approach allowed teams to map and eliminate potential causes, ensuring corrective actions that safeguarded product integrity.
Possible causes:
- Manpower – Issues related to operator skills and training
- Method – Problems with production procedures
- Machine – Failures or inefficiencies in equipment
- Material – Variations or defects in raw ingredients
- Environment – External conditions like humidity and temperature
- Measurement – Gaps or weaknesses in quality control inspections

📋 Proposed Corrective Actions:
- Enhance operator training focused on critical drying parameters.
- Standardize drying process settings and enforce real-time monitoring.
- Schedule regular cleaning and maintenance of spray dryers.
- Implement stricter quality control on incoming raw milk.
- Improve storage conditions to control humidity.
- Increase frequency and rigor of taste sampling during production.
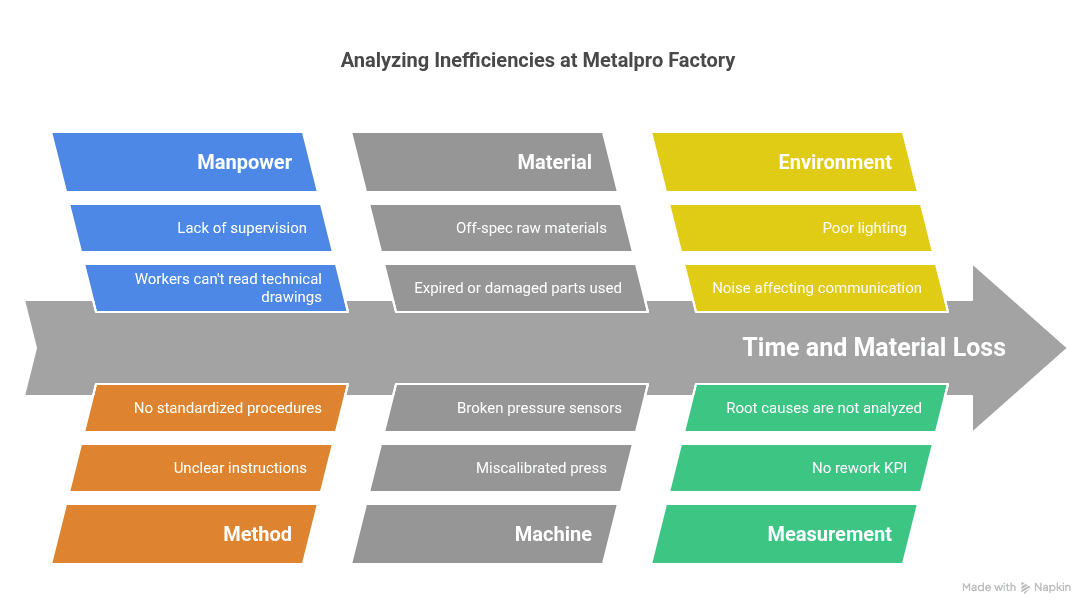
Example 3: Frequent Rework in Production
The factory "Metalpro" is losing time and materials due to parts that don’t meet specifications and need rework.
Possible causes:
- Manpower: workers can't read technical drawings; lack of supervision
- Method: unclear instructions; no standardized procedures
- Material: off-spec raw materials; expired or damaged parts used
- Machine: miscalibrated press; broken pressure sensors
- Environment: poor lighting; noise affecting communication
- Measurement: no rework KPI; root causes are not analyzed
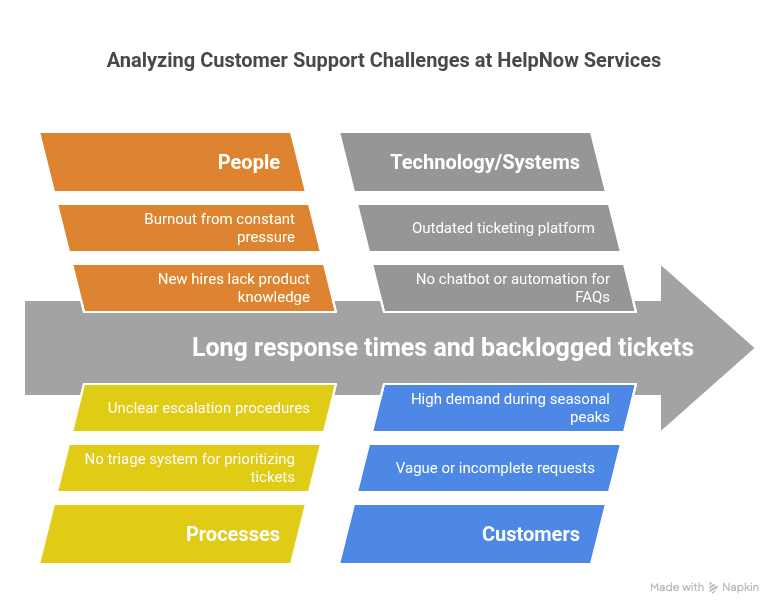
Example 4: Low Productivity in a Customer Support Team
The customer support team at "HelpNow Services" is struggling with long response times and backlogged tickets, affecting client satisfaction.
Possible causes:
- People: new hires lack product knowledge; burnout from constant pressure; poor communication between shifts
- Processes: no triage system for prioritizing tickets; unclear escalation procedures
- Technology/Systems: outdated ticketing platform; no chatbot or automation for FAQs
- Customers: clients send vague or incomplete requests; high demand during seasonal peaks
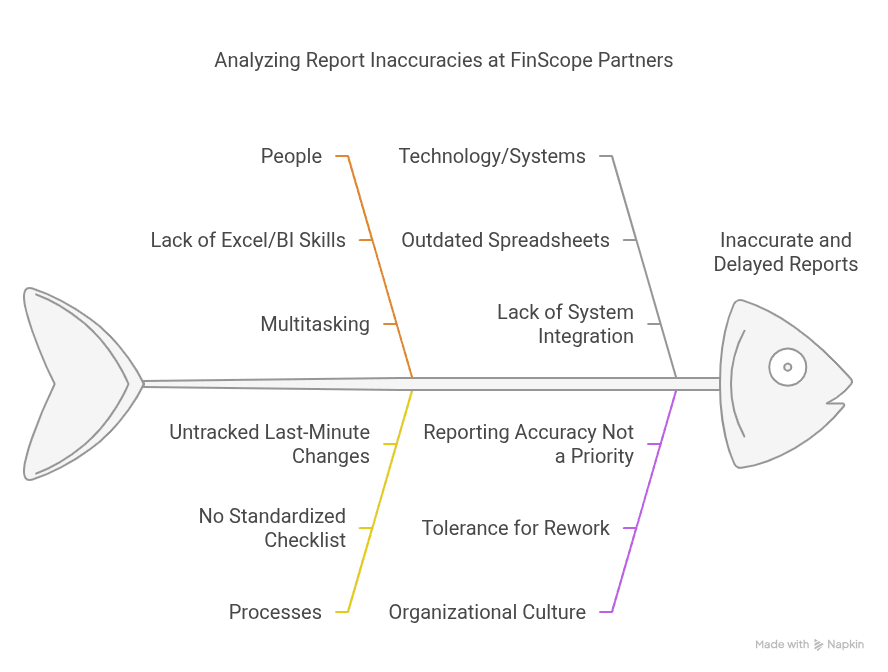
Example 5: Frequent Errors in Monthly Financial Reports
At the consulting firm "FinScope Partners," the finance team consistently submits reports with incorrect figures or missing data, delaying executive decisions.
Possible causes:
- People: team lacks advanced Excel/BI skills; analysts are multitasking across departments
- Processes: no standardized checklist for report validation; last-minute changes go untracked
- Technology/Systems: reliance on outdated spreadsheets; lack of integration between accounting and ERP systems
- Organizational Culture: tolerance for rework; reporting accuracy not treated as a strategic priority
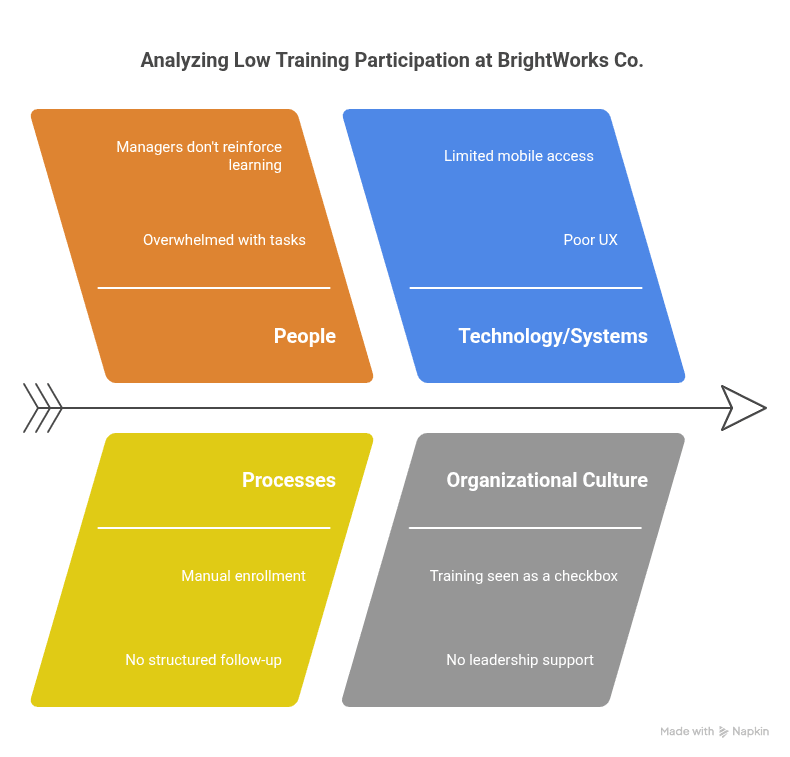
Example 6: Low Engagement in Corporate Training Programs
"BrightWorks Co." invests heavily in employee training, but participation is low and completion rates are poor—even in mandatory modules.
Possible causes:
- People: employees feel overwhelmed with tasks; managers don’t reinforce learning culture
- Processes: training enrollment is manual and time-consuming; no structured follow-up or reinforcement
- Technology/Systems: learning platform has poor UX; mobile access is limited or buggy
- Organizational Culture: training is seen as a checkbox; no visible support from leadership
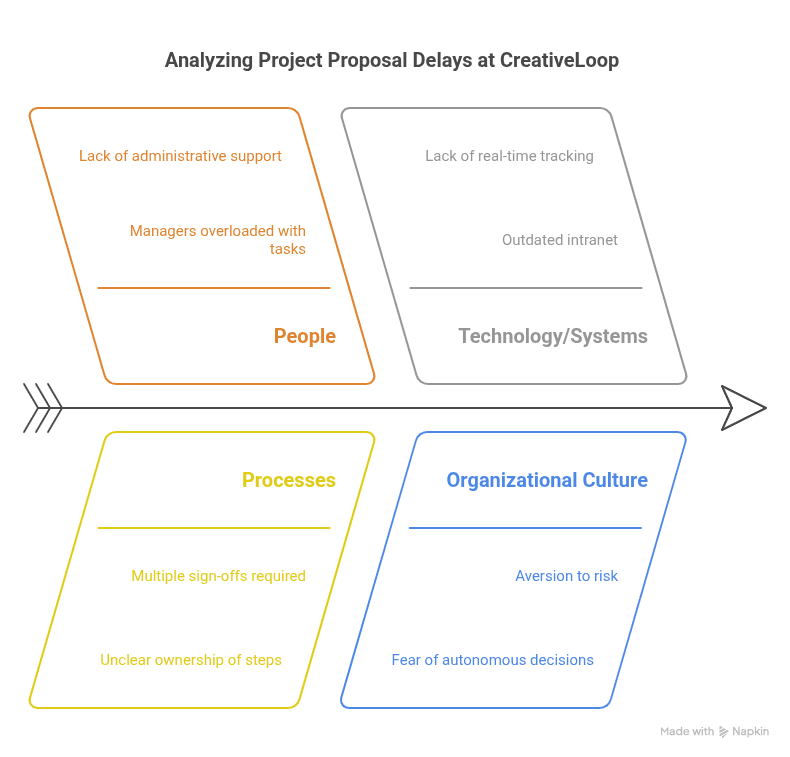
Example 7: Delays in Project Approvals
At the marketing agency "CreativeLoop," internal project proposals are often delayed for weeks waiting on approval from management, slowing campaign delivery.
Possible causes:
- People: managers overloaded with tasks; lack of administrative support
- Processes: approval workflow requires multiple sign-offs; unclear ownership of each step
- Technology/Systems: outdated intranet used for submissions; lack of real-time tracking
- Customers: client scope changes not reflected in project docs; constant resubmission requests
- Policies and Rules: overly formal procedures for small projects; no fast-track options
- Organizational Culture: aversion to risk; fear of making autonomous decisions without C-level sign-off
Conclusion
The Ishikawa Diagram is a fundamental tool for continuous improvement projects in both industrial and service environments. It promotes critical thinking, organizes team discussions, and helps uncover true root causes, making it a key step before implementing corrective actions.
👉 Want to go further? Check out our article on Business Process Improvement to discover step-by-step strategies, tools, and real success stories to elevate your organization's performance.